This edition of Modern Restaurant Management (MRM) magazine's Research Roundup features digital trends, drone delivery trends and a super amount of Super Bowl stats.
Restaurant Digital Trends
BentoBox released its 2018 Year in Review, a comprehensive look at digital trends in the restaurant industry. The following insights were gathered from over 3,100 restaurants, 59,000 online transactions, 530,000 menu items, and 210 million restaurant website visits.
Key takeways include:
- 58 percent of website visits are made on mobile devices, up eight percent since 2017

- 12.5 percent is the average tipping amount online

- 15 reservations per day are booked through a restaurant’s website
- Monday is the busiest day for online catering orders, while 11:30 a.m. – 12 p.m. is the busiest time during the week
- Donuts are the most-liked food restaurants post on Instagram
BentoBox’s CEO Krystle Mobayeni said, “We’ve seen consumers continue to prioritize community and invest in local business, allowing restaurants to become their own lifestyle brands, extending their offerings beyond the meal. From eCommerce to entertainment to social engagement, a website is a crucial platform that allows a restaurant’s brand to grow while impacting their bottom line and creating more opportunities to connect with guests.”
Read more about BentoBox’s 2018 trends and data insights here.
State of Delivery
Motus' 2019 State of Delivery Trend Report revealed that though workers for use of their personal vehicles for business, 82 percent of employers don’t ask workers to track mileage in any way, 39 percent reimburse their delivery workers with a flat amount, 24 percent include the use of employee vehicles and vehicle-related expenses in the employee’s wage and 10 percent reimburse employees for mileage.
The report provides examples of major U.S. cities where using a flat amount per delivery can impact delivery workers’ actual wage. For example, when a flat amount is paid per delivery in New York, NY, the high costs of driving in the city significantly decreases the average delivery worker’s take-home wage.
Additional findings in the 2019 State of Delivery Trend Report include:
- 31 percent of employers said that the most important factor when hiring a delivery worker is finding someone with the ability to represent the brand well. 25 percent cited a safe driving record, 22 percent pointed to availability, 10 percent value a driver’s ownership of a vehicle, 8 percent relevant experience and 4 percent cited other factors as the most important to consider when hiring delivery workers.
- An overwhelming majority of employers use their own employees to deliver their goods and services (79 percent). However, at the same time, many have started to explore the world of using third-party vendors, contractors or gig workers to deliver goods (21 percent).
- Employers are largely undecided about whether they’d hire on-demand or gig workers to deliver their goods. 28 percent said they would hire gig delivery workers, 38 percent said they would not and 34 percent admitted they were unsure.
- 86 percent of respondents reimburse or credit customers for incorrect orders or late deliveries. Incorrect orders/late deliveries cost 60 percent of businesses $100 or less each month, but for an unlucky 20 percent, these costs balloon to in between $100 and $500 a month.
Drone Delivery Market
According to Coherent Market Insights, the global delivery drones market is projected to exhibit an impressive CAGR of 22.3 percent over the forecast period (2018 – 2026).
Increasing usage and adoption of drones in e-commerce/ quick service and restaurants/ healthcare supplies, and introduction of hybrid drones for transportation and logistics sector are some major factors driving growth of the delivery drones market. Moreover, increasing delivery drone fleet sizes due to expanding geographical reach by e-commerce service providers such as Amazon, Google, and UPS are expected to aid in growth of the delivery drones market during the forecast period.
Complex terrain and limited range of drones are some major factors restraining growth of the market, owing to lack of capability to drop the product at exact locations in dense and low connectivity areas such as rural and mountain areas. The limited range and lesser flight time of delivery drone is expected to be a negative factor, which will impact the delivery drones market during the forecast period.
The global delivery drones market is segmented on the basis of drone type, application, component, and region. Among drone type, rotor blade segment held the dominant position in the market in 2017, owing to its high quality of vertical take-off and landing capability, ease of use, and enhanced control and stability to hover in air.
Among application, e-commerce segment held the dominant position in the market in 2017, and is expected to retain its position throughout the forecast period. This is owing to high usage of drones in e-commerce industry for delivery of products in rural areas, where transportation vehicle cannot be reached or takes longer time. Furthermore, increasing e-commerce sector is expected to propel growth and adoption of delivery drones in different regions. Moreover, e-commerce companies are focusing on availing approvals for usage of drones for product delivery at different countries by the respective government, wherever restrictions or ban on use of drones is imposed under certain circumstances. For instance, in 2016, Amazon signed a contract with the UK government to test the usage of drones for product delivery in the country and in December 2016, the company delivered its first product (Amazon Fire TV streaming device and a bag of popcorn) with drone in the UK.
North America was the dominant region in the global delivery drones market in 2017, and is projected to maintain its dominance during the forecast period, owing to increasing use of delivery drones for commercial as well as military applications (medic supplies) in the region. Moreover, North America is expected to be the second fastest growing region for delivery drones market, owing to increasing production and deliveries of drones in the region for commercial purposes.
Furthermore, increasing adoption and usage of drones in China by e-commerce vendors such as JD.com and Alibaba are fueling the Asia Pacific delivery drones market in the region. Right now JD.com has around 40 delivery drones, which deliver various products at different locations in China. The market is expected to witness a CAGR of 22.3 percent during the forecast period (2018–2026), owing to increasing adoption of drones in the e-commerce transportation & logistics industry
Increase in demand for drones with higher payload capacity, higher range, and increased flight time for delivery of products such as e-commerce industry are some major factors driving growth of the market. Moreover, stringent government laws for drones in different regions act as a restraining growth of the market. For instance, government of various countries such as India, Argentina, Cuba, Slovenia, Saudi Arabia, Morocco, Barbados, and Uzbekistan does not allow the usage of drones for commercial purposes in their countries
Some of the major players operating in the global delivery drones market include The Boeing Company, Airbus SE, CyPhy Works, JD.com, SKYCART Inc., Drone America, Matternet, SZ DJI Technology Co. Ltd., and others
Keeping Resolutions
When it comes to healthy eating New Year’s Resolutions, 2019 is off to a promising start.
Data from ezCater, reveals salad orders grew by 10 percent nationally through the year's first three weeks, while pizza orders nosedived by 20 percent, compared to the same period last month.
The network that connects millions of lunch-hungry office dwellers with over 60,000 restaurants and other caterers annually also produced some notable city-specific data:
- Indianapolis is 2019's healthy eating star thus far (salad orders up 36 percent, pizza orders down 56 percent)
- Silicon Valley (salad up 23 percent, pizza down 6 percent) and Seattle (salad up 26 percent, pizza down 27 percent) are in a tech HQ good eating grudge match
- Los Angeles is keeping up its spa cuisine image (salad up 12 percent, pizza down 37 percent)
- Boston can add better food bragging rights to its beloved Sox and Pats boasts (salad up 15 percent, pizza down 30 percent)
- Chicago has moved well past its brats 'n beers rep…at least come lunchtime (salad up 6 percent, pizza down 31 percent)
Thanksgiving or Christmas?
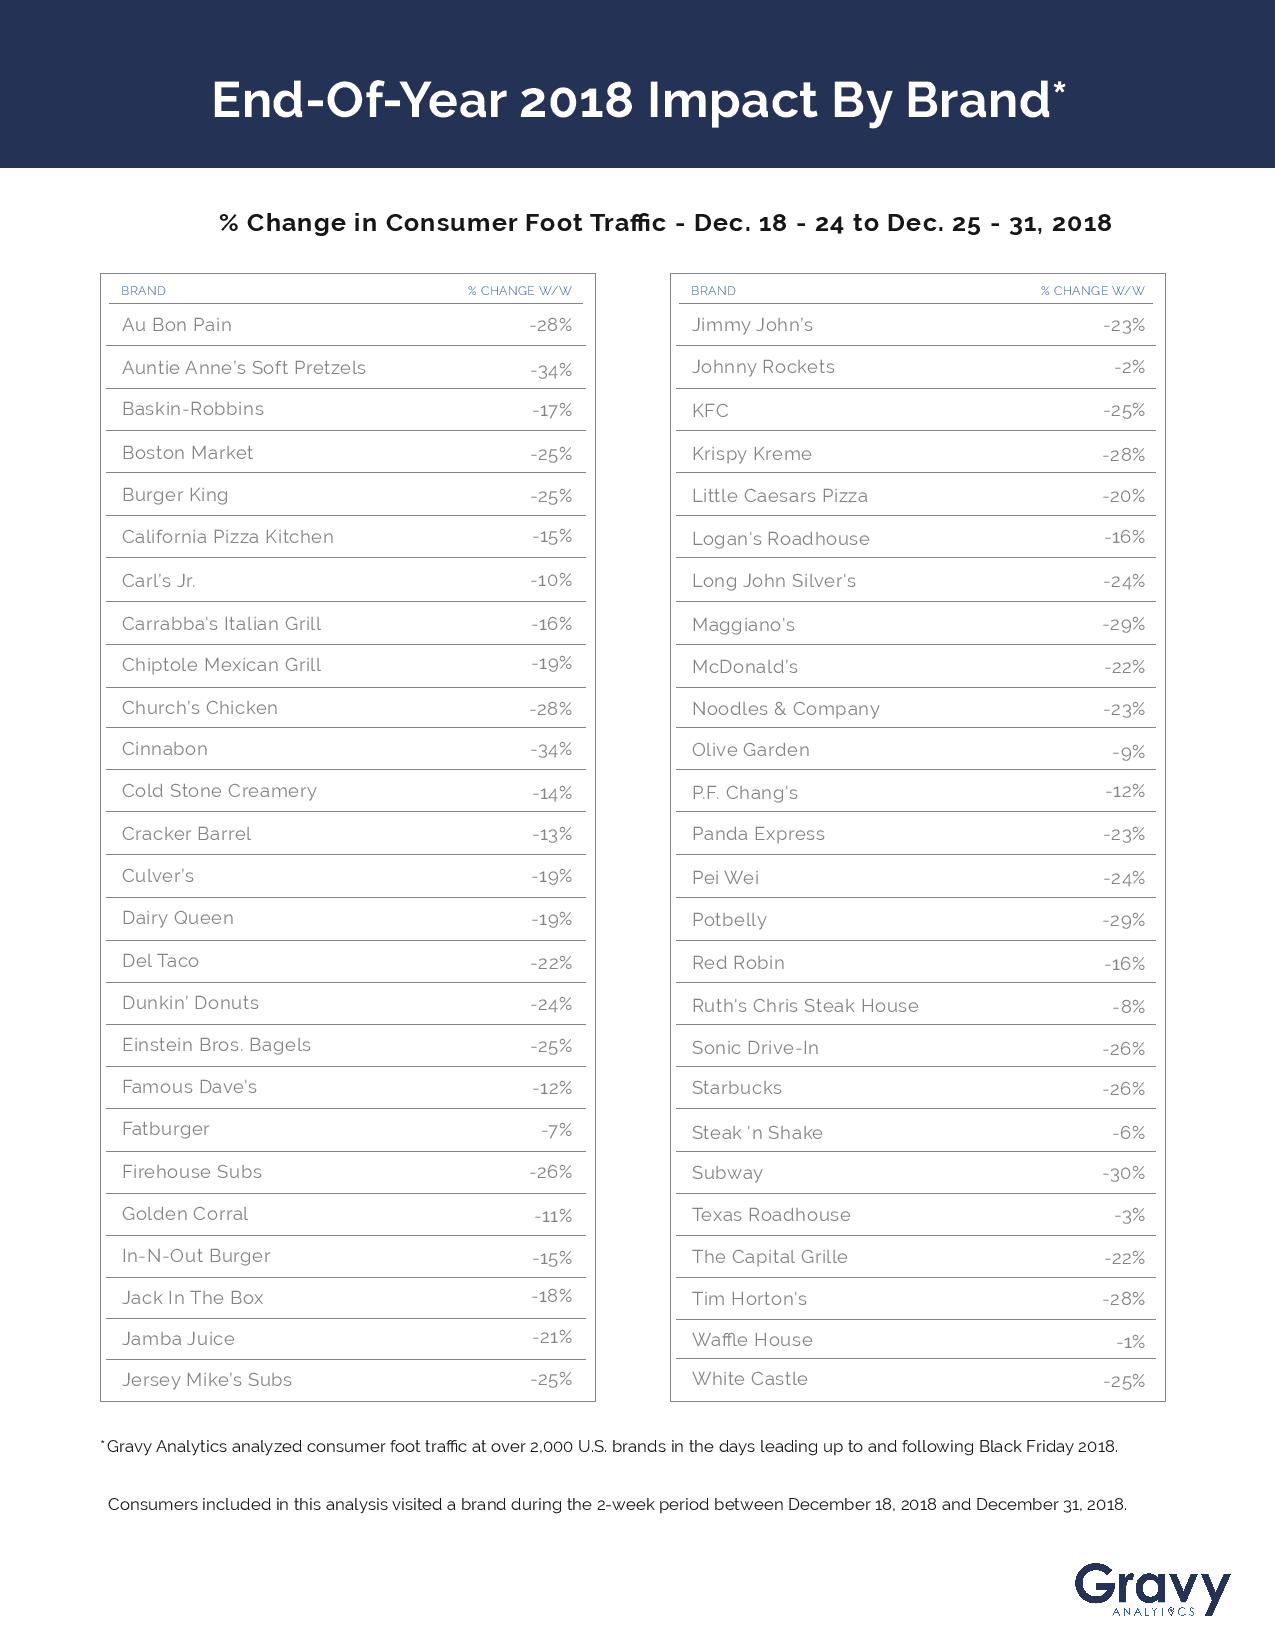
While most restaurant chains saw a slump in customer traffic around the Thanksgiving and Christmas holidays, Gravy Analytics, a location-intelligence platform, found that certain fast food chains fared better during the week of Thanksgiving than Christmas/New Years.
Auntie Anne’s: 11 percent (November) to -34 percent (December)
Burger King: -7 percent (November) to -25 percent (December)
Cinnabon: 40 percent (November) to -34 percent (December)
McDonald’s: -6 percent (November) to -22 percent (December)
Dunkin Donuts: -6 percent (November) to -24 percent (December)
The above findings compare foot traffic at more than 2,000 food chains during the weeks of Nov. 12-19 and Nov. 20-26, 2018 with Dec. 18-24 and Dec. 25-31, 2018.
Popular Super Bowl Food
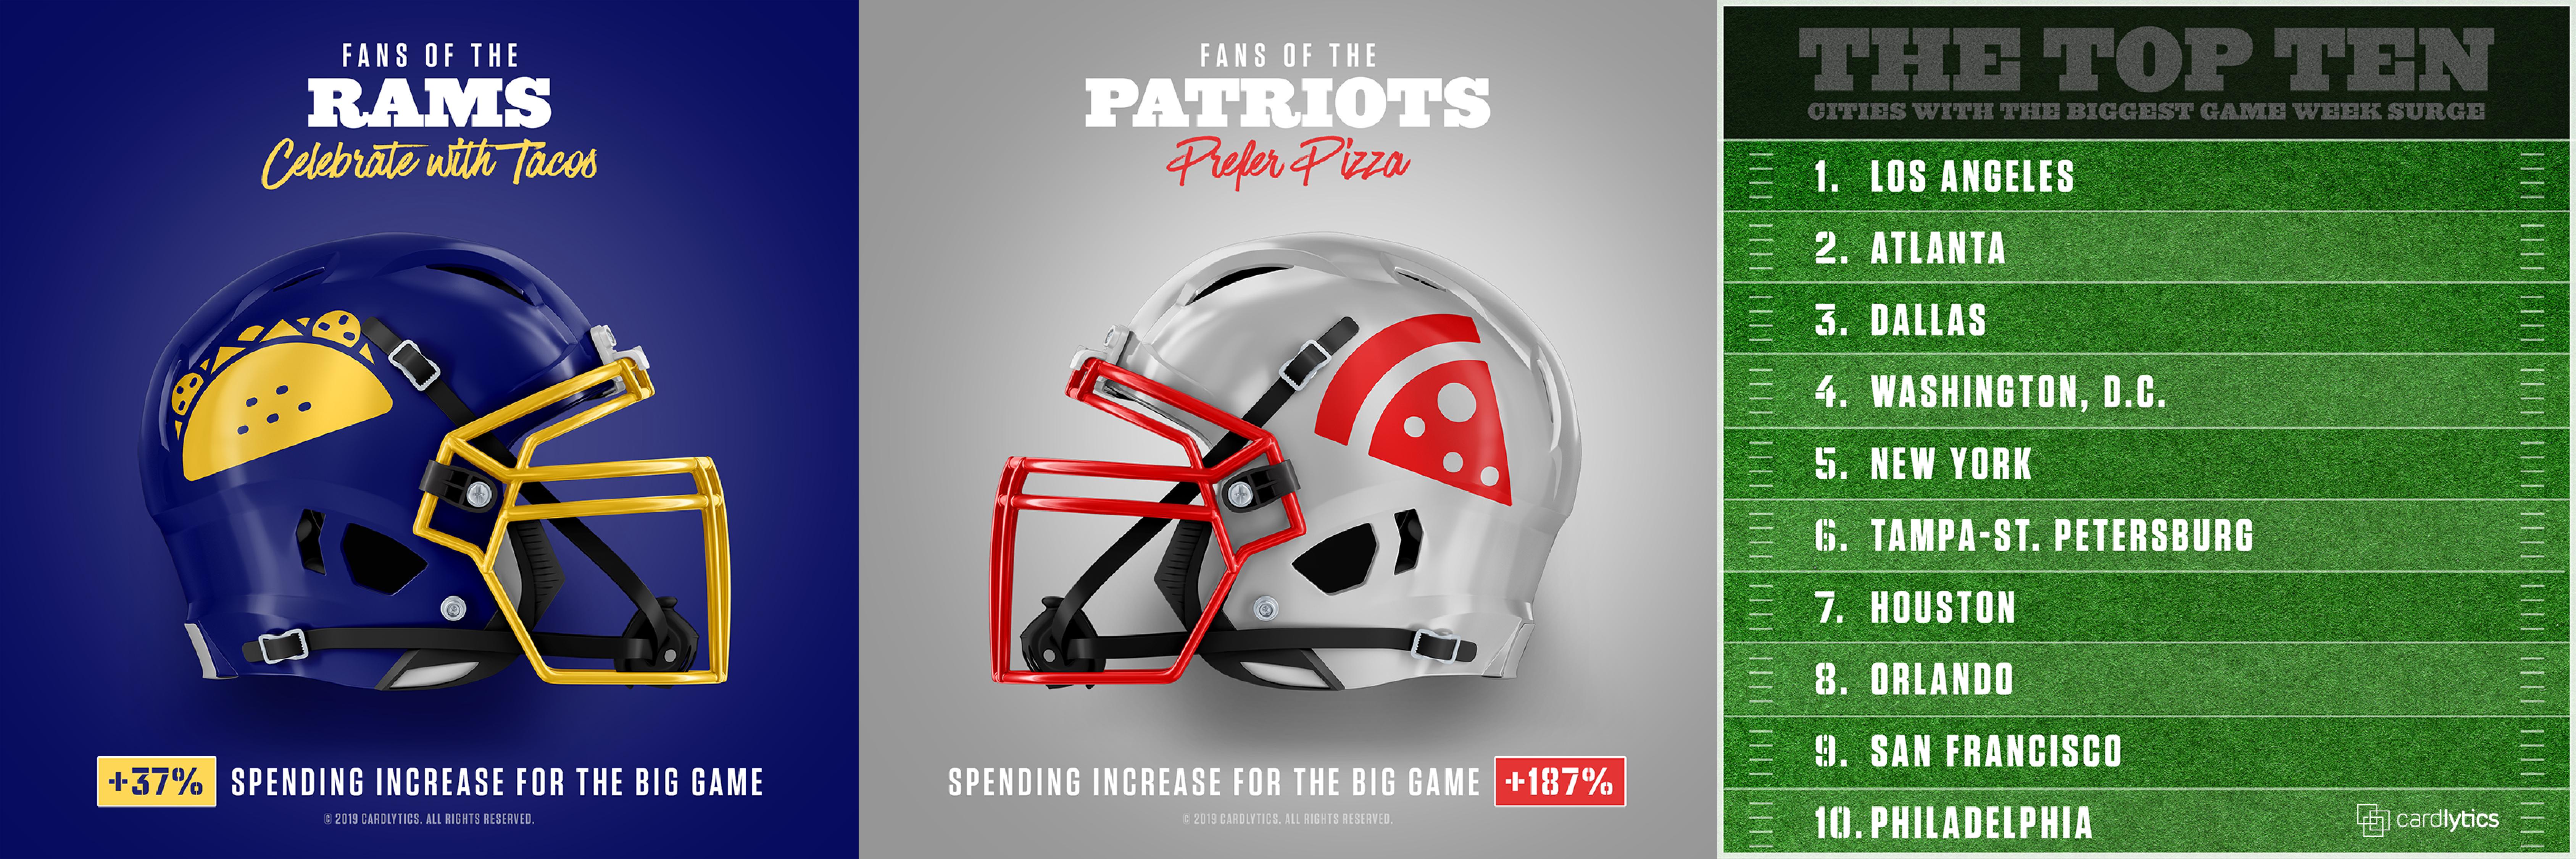
For restaurants, this Sunday isn’t about New England or Los Angeles, it’s about gaining the most yardage at the viewing party table. According to newly released data from Cardlytics, pizza dominated food budgets in the Patriots’ hometown of Boston last year with a 187 percent increase in spend compared to an average week. But for Los Angeles, it was all about the tacos with a 37 percent increase in spend over annual averages.
These insights come from Cardlytics, which partners with more than 2,000 financial institutions to run their digital rewards programs. The company leverages proprietary insights to understand where and when consumers spend their money, helping marketers reach likely buyers through the banks’ mobile, online, and email channels. Cardlytics’ fraud-free native advertising platform reaches more than 85 million monthly active users and analyzes $2.3T in consumer spend.
This spending data surrounding The Big Game also revealed that football fans overall spent 12 percent more nationally during the 2018 championship versus 2017. In this year’s host city of Atlanta, chicken made a big run with a 128 percent boost in sales, and the meal is the fastest growing food choice for football fans with spend surging 19 percent nationally in 2018 compared to 2017.
“The February championship is an exciting time, not only for the game and the commercials, but also in the all-important area of dining,” said Matt Drewes, Cardlytics senior vice president and group head of restaurants. “At Cardlytics, we can help restaurants gain market share, whether it’s leading into a big event or otherwise, by applying sophisticated analytics to our massive purchase dataset and delivering real insights into the customer’s buying behavior. This allows brands to identify blind spots and gauge headroom for growth within their categories.”
Other key findings around food purchases during the week of The Big Game include:
- Spend grew 29 percent in Atlanta and 31 percent in all of Georgia from 2017 to 2018.
- Tennessee (27 percent growth), Virginia (24 percent growth), and Florida (20 percent growth) experienced three of the largest spikes in spend for 2018 compared to 2017.
- Sioux Falls, South Dakota (15 percent decrease), Mankato, Kansas (12 percent decrease), and Topeka, Kansas (11 percent decrease) saw the most notable decreases in spend from 2017 to 2018.
- Chicago and St. Louis are the only two cities whose residents preferred to eat sandwiches on game day, respectively spending 85 percent and 73 percent more on this item the week of the championship than average.
Methodology: U.S. consumer spend at barbeque, premium burger, chicken, taco, pizza, and sandwich locations the week of the championship game (between February 1, 2018 and February 7, 2018, and February 2, 2017 and February 8, 2017), compared to annual averages captured between January 5, 2017 and January 2, 2019.
Big Game Wing-onomics
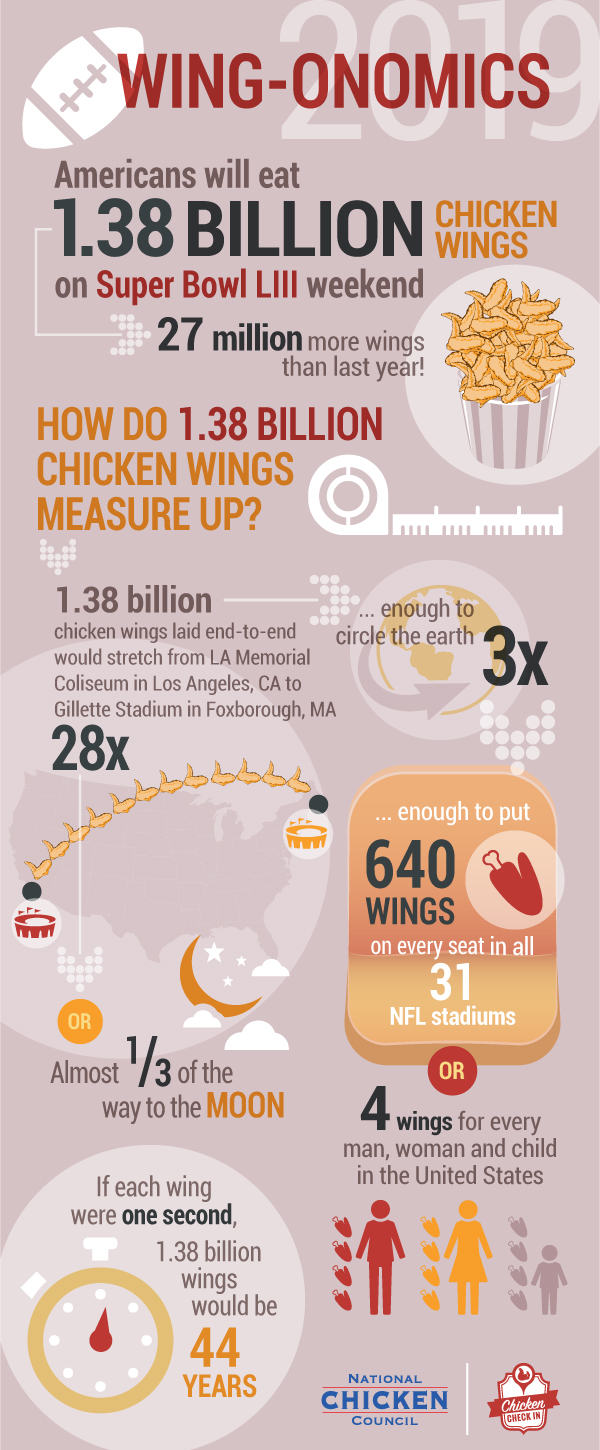
Will Americans be ‘winging it’ for the Big Game? The National Chicken Council (NCC) has released its annual Chicken Wing Report, and the answer is a resounding “yes!” NCC projects Americans’ consumption of the unofficial gameday menu staple – the chicken wing – will hit an all-time high at 1.38 billion wings during Super Bowl LIII weekend, as the Los Angeles Rams and New England Patriots battle for the Lombardi Trophy. This figure is up two percent, or about 27 million wings, from 2018.
How do 1.38 billion chicken wings measure up?
- If 1.38 billion wings were laid end to end, they would stretch back and forth 28 times from Gillette Stadium in Foxborough, Massachusetts to Los Angeles Memorial Coliseum.
- 1.38 billion wings weigh 6,600 times more than the combined weight of both the Patriots’ and Rams’ entire rosters.
- Enough to put 640 wings on every seat in all 31 NFL stadiums.
- Enough to circle the Earth 3 times.
- If each wing were one second, 1.38 billion wings would be 44 years.
- That’s 4 wings for every man, woman and child in the United States.
As the saying goes, “I’ll just eat one. Said no one ever.”
As Americans unite around their shared love of the chicken wing during Super Bowl LIII, NCC is petitioning President Trump and Congress to declare the Monday after the Super Bowl a federal holiday: “National Chicken Wing Appreciation Day.” Declare your support for the federal holiday – and love of the wing – by signing the petition here.
“Whether you’re a fan of the left wing or the right wing, there’s no debate – or controversial missed calls – about America’s favorite Super Bowl food,” said National Chicken Council spokesperson Tom Super.
Love the Local Flavors
Grocery retailers and local restaurants are making preparations in advance of the big game next week as consumers make their plans. According to Frito-Lay, individual cities have their own snacking preferences – however, one thing is consistent no matter where you live, what you’re buying or who you’re cheering for: consumers like to shop locally.
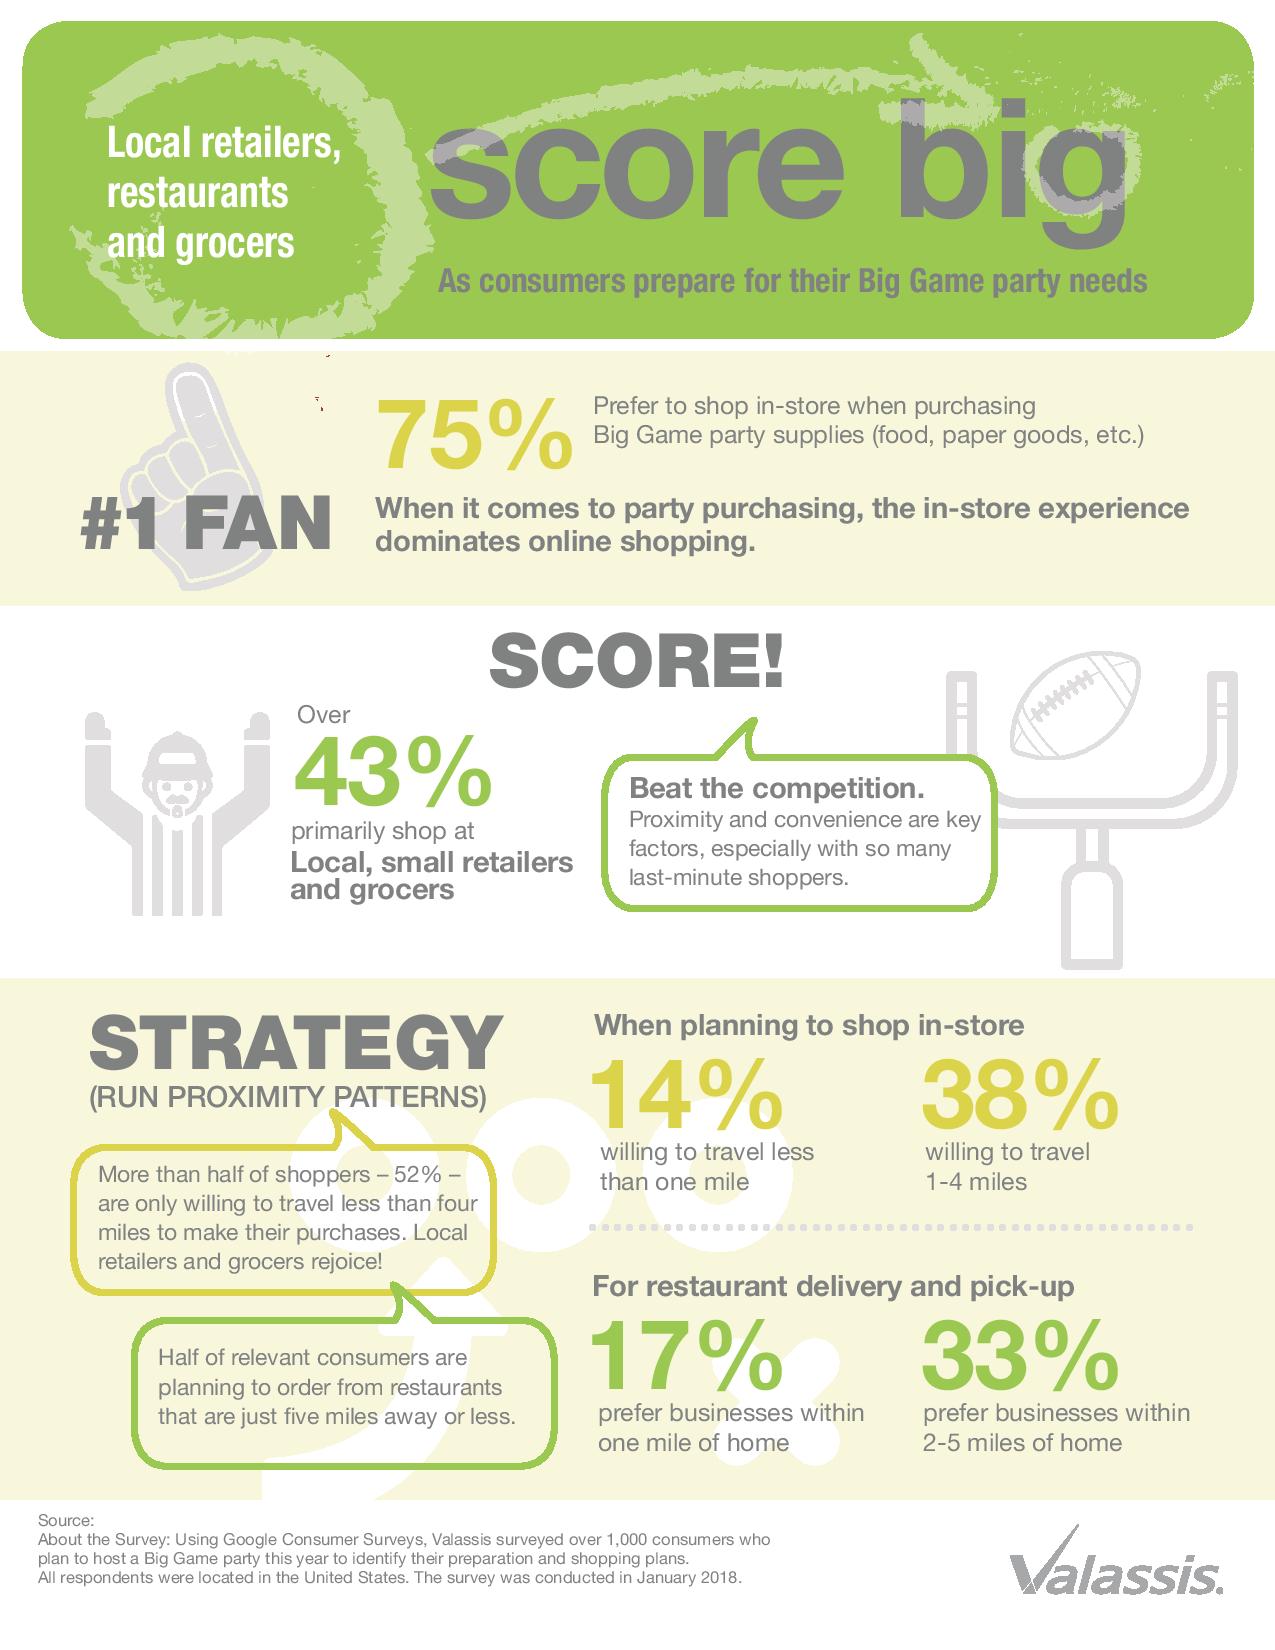
In a survey conducted last year of over 1,000 US consumers, Valassis found that 52 percent are willing to travel less than four miles for their big game purchases and 43 percent will shop locally. Given your interest in restaurant trends, would you be interested in scheduling a conversation with Curtis Tingle, chief marketing officer at Valassis to discuss how small businesses have an opportunity to sell big next week? Curtis can discuss how small businesses can be wiser this year when prepping for the big game. I’ve included additional takeaways from the survey below for consideration.
Super Bowl Super Spend
American adults say they will spend an average $81.30 for a total of $14.8 billion as they watch the New England Patriots and the Los Angeles Rams meet up in the Super Bowl next month, according to the annual survey released today by the National Retail Federation and Prosper Insights & Analytics.
“You don’t have to be a football fan to celebrate the Super Bowl,” NRF President and CEO Matthew Shay said. “Whether it’s to see who wins, watch the halftime show and commercials or just get together with friends, this is the biggest party since New Year’s Eve. Spending is expected to be at one the highest levels we’ve seen. And retailers are ready whether you need food, team jerseys, decorations or a new TV.”
The average spending is virtually unchanged from last year’s $81.17 and is the second-highest in the history of the survey after a record of $82.19 set in 2016. The total amount is down from last year’s $15.3 billion, primarily because fewer people plan to watch the game – 182.5 million this year compared with 188.5 million last year. The overall spending is still the third-highest on record, after last year’s figure and $15.5 billion in 2016.
The biggest spenders are those ages 35-44 at an average $123.26 while the lowest are those 65 and older at $40.97. Viewers in the Northeast plan to spend the most, at an average $94.89, followed by the West at $84.01, the South at $79.09 and the Midwest at $69.24.
The survey found that 72 percent of adults plan to watch the game, down from 76 percent last year. Among those watching, 79 percent plan to buy food and beverages, 10 percent team apparel and accessories, 7 percent decorations, also 7 percent for new televisions, and 4 percent furniture such as entertainment centers.
Close to a quarter (24 percent or 61 million) plan to attend a party, while 17 percent (44 million) will throw one while 5 percent (13 million) will watch in a bar or restaurant. The largest share of those watching (43 percent) say the game is the most important part of the event, but 23 percent cite the commercials, 14 percent getting together with friends, 13 percent the halftime show and 7 percent the food.
The survey found that 76 percent see the commercials as entertainment and that only 10 percent say they are influenced to make a purchase, but the ads carry more weight among younger viewers. Of those ages 18-24, 17 percent say the commercials influence them to buy and 16 percent are prompted to search online for more information.
“The numbers vary from year to year, but regardless of the economy, politics or the weather, most Americans manage to take a break every year for the Super Bowl,” Prosper Vice President of Strategy Phil Rist said. “The big game is a day for big spending regardless of who plays or wins.”
The survey of 7,384 adults 18 and older was conducted January 2-9, before it was known which teams would play, and has a margin of error of plus or minus 1.2 percentage points. The viewership numbers may differ from other figures such as official TV ratings because they include all individuals who say they will watch regardless of how or where.
Valentine's Day Spend
Americans are expected to spend a record amount on Valentine’s Day this year despite a years-long decrease in the percentage of people celebrating the holiday, according to the annual survey released today by the National Retail Federation and Prosper Insights & Analytics.
“The vast majority of Valentine’s Day dollars are still spent on significant others, but there’s a big increase this year in consumers spreading the love to children, parents, friends and coworkers,” NRF President and CEO Matthew Shay said. “Those who are participating are spending more than ever and that could be the result of the strong economy. With employment and income growing, consumers appear to be expanding the scope of who qualifies for a card or a box of candy.”
Those surveyed said they would spend an average $161.96. That’s up 13 percent from last year’s $143.56 and easily tops the previous record of $146.84 set in 2016. Total spending is expected to be $20.7 billion, which is an increase of 6 percent over last year’s $19.6 billion and breaks the previous record of $19.7 billion, also set in 2016.
The spending increases come even though only 51 percent of Americans plan to celebrate the holiday, down from 55 percent last year and a high of 63 percent in 2007. It is unclear why the number of consumers celebrating has trended downward over the past 12 years, but spending, while varying with the economy, has generally trended up. The lowest spending during the period was $102.50 in 2009 during the Great Recession.
Of the $18.40 increase in average spending, only $4.26 comes from spending on spouses and significant others, which is expected to total $93.24. Consumers said they would spend $29.87 on other family members, up $4.58; $9.78 on friends, up $2.59; $8.63 on children’s classmates or teachers, up $1.37; $7.78 on co-workers, up $2.99; $6.94 on pets, up $1.44 and $5.72 on others, up $1.17.
As in each year of the survey, men are the biggest spenders at $229.54, up 20 percent from last year. That’s more than double the $97.77 women said they would spend, which is down 1 percent, and is within the survey’s margin of error.
Among age groups, those 35-44 are the biggest Valentine spenders at $279.14, followed by those 25-34 at $239.07. Both groups typically have more people to buy for including children and children’s classmates or teachers.
Gifts for pets continue to be popular, purchased by 20 percent. Pet spending is expected to total $886 million, up $519 million since NRF first asked in 2008.
Those celebrating plan to spend $3.9 billion on jewelry (given by 18 percent), $3.5 billion on an evening out (34 percent), $2.1 billion on clothing (18 percent), $1.9 billion on flowers (35 percent), $1.8 billion on candy (52 percent), $1.3 billion on gift cards (15 percent) and $933 million on greeting cards (44 percent). Gifts of experience such as tickets to an event or a trip to a spa are wanted by 40 percent and planned to be given by 25 percent.
Department stores are the most popular Valentine’s Day shopping destination, visited by 35 percent of shoppers, followed by discount stores (32 percent), online (27 percent), specialty stores (18 percent), florists (16 percent), small or local businesses (14 percent), jewelry stores and specialty clothing stores (each 9 percent).
Even among those who don’t plan to celebrate Valentine’s Day as such, 11 percent plan to treat themselves to gifts like clothing or jewelry and 9 percent plan to get together with other single friends or family.
“Valentine’s Day means different things for different people,” Prosper Vice President of Strategy Phil Rist said. “Whether it’s a day of romance or one of making sure their children have enough cards in their backpacks for each of their classmates, it’s an important day for those who choose to participate.”
The survey of 7,384 adults 18 and older was conducted January 2-9 and has a margin of error of plus or minus 1.2 percentage points.
Small Business Gains
The Paychex | IHS Markit Small Business Employment Watch started the new year with slight gains in small business job and hourly earnings growth. The Small Business Jobs Index increased 0.04 percent in January to 98.92, though it remains down 0.96 year-over-year. At 2.49 percent ($0.65) in January, hourly earnings growth has improved each month since August with wages now standing at $26.88. Weekly earnings growth, however, has slipped below two percent as weekly hours worked have declined.
“With a 0.04 percent increase in January, the recent losses seen in small business job growth abated to begin the new year,” said James Diffley, chief regional economist at IHS Markit.
“The uncertainty caused by the government shutdown doesn’t appear to have had a major negative impact on small business hiring, which increased for the first time since May 2018,” said Martin Mucci, Paychex president and CEO. “The job gain is certainly welcome news, but it remains a challenging hiring environment for small businesses given the low unemployment levels.”
Broken down further by geography and industry, the December report showed:
- The top region for both employment and wage growth is the West.
- Wisconsin is the strongest state for small business job growth; California took over as the top state for wage growth.
- Dallas remains first among metros in job growth; Riverside, California is once again the top metro for wage growth.
- With a 0.14 percent increase in January, Construction is back above 100 and ranks second among industries in jobs growth.
The complete results for January, including interactive charts detailing all data at a national, regional, state, metro, and industry level, are available here.
Vegans Want Healthy
Brands in the UK should ensure their vegan food products remain healthy to consumers, says GlobalData. As veganism becomes increasingly available in mainstream retail, consumers’ attention inevitably shifts towards how healthy a vegan product is. Brands should address this by reducing sugar and salt levels in processed vegan food, removing allergens and adding ingredients beneficial for the vegan diet, says GlobalData, a leading data and analytics company.
GlobalData’s 2018 Q3 survey found that three percent of consumers in the UK were describing their daily diet as vegan, a moderate figure, but still bigger than the global two percent.
Aleksandrina Yotova, Consumer Analyst at GlobalData, comments: “Growth in the vegan food sector comes mostly from the rise of the number of flexitarian consumers willing to stick to a vegan diet for a period of time or a few days each week.
“This has led to more vegan products being released with a number of major brands and private labels launching vegan options to their line-ups. While these products are better for the animal welfare, not all vegan foods are healthier than the standard options and this is noticed by consumers.”
M&S’s new Plant Kitchen vegan range has been reported to feature allergy related warnings, which not only contradict the vegan nature of the range but also suggest a risk for allergy sufferers. Greggs’ newly popular vegan sausage roll has been reported to have more salt than the original and nearly a gram of sugar, which makes its health benefits debatable.
Yotova concludes: “As consumers want vegan products to be healthier alternatives to meat and dairy, the lack of clarity will be off putting for some. Future trends in vegan food will follow the same philosophy that consumers apply to eating in general: eat whole, real foods with as little processing as possible. Vegan food products will need to keep this philosophy central to their product formulations, as many have been doing for decades.”
Social Media Interaction
Thirty percent of social media users interact on social media at least 10 times per day by either liking, sharing, or posting content, according to a new survey from The Manifest, a business news and how-to website.
Social media is part of people’s everyday routines because it helps people build a community with others around the world.
“Social media has become ingrained in our day-to-day lives,” said Charlotte Chipperfield, founder and CEO of Chipperfield Media. “We use it for more than just sharing personal updates. It’s a way of building a community around our shared interests.”
People Prefer to Post Images on Social Media
People clearly want others to see their photos and memes – images are the only content type that more than half of social media users regularly post.
Nearly 70 percent of users post images, compared to 47 percent who post updates/announcements, 46 percent who post videos, and 42 percent who post opinions.
Images are popular because they are the most likely to capture people’s attention.
“Nowadays, people are in a very fast-paced environment [and] want to consume the most amount of information as quickly as possible, so photography can help that,” photographer Pedro Kin said. “Not many people will stop and read a post.”
Nearly Half of Social Media Users Post Content Daily
Although interacting with other people’s content is important to most social media users, nearly all (94 percent) post their own content, including 42 percent who do so at least once a day. Social media lets people interact beyond their immediate surroundings.
“The average person living in a suburb could live on a little street with very little exposure to the outside world but have a community of thousands of people on social media who are engaged with their posts,” said Joseph Rothstein, account manager at Social Media 55.
Facebook Remains Popular
Reports that people have stopped using Facebook are premature – Facebook is still the most-used social media channel.
More than half (52 percent) of people use Facebook the most often among social media platforms, more than three times the number of people who most often use YouTube (16 percent) and Instagram (14 percent).
Even the most ardent Facebook fans, however, may be spending less time per visit on Facebook because they are visiting other channels.
“Even if people are still clicking on the app or going to Facebook.com on their browser the most, the amount of time they spend on the platform has decreased,” said Andrew Selepak, graduate director of the social media department at the University of Florida. “If I watch a 20-minute YouTube video, I’m probably not spending a 20-minute block on Facebook.”
The Manifest’s 2019 Consumer Social Media Survey included 627 people in the U.S. who use social media at least once per week.
Read the full report here.
Culinary Tourism Market
he global culinary tourism market is expected to post a CAGR of over 9 percent during the period 2019-2023, according to the latest market research report by Technavio. Increase in integrative culinary and cultural events introduced at music and arts festivals offer opportunities to food service providers and other culinary tourism suppliers to get access to the large customer bases. The introduction of food trucks is a critical factor that will boost market growth. These food trucks provide customers with a broad and trendy selection of local flavors. Destination management organizations (DMOs) are also taking note of the growth of different art and festival events, and the role of food in them. Many destinations worldwide have started collaborating with local businesses and celebrated native chefs to promote activities that focus on different types of culinary offerings.
As per Technavio, the growing popularity of sustainable and organic culinary tourism will have a positive impact on the market and contribute to its growth significantly over the forecast period. This global culinary tourism market 2019-2023 research report also analyzes other important trends and market drivers that will affect market growth over 2019-2023.
Growing popularity of sustainable and organic culinary tourism
Currently, tourists are interested in the origin of food, drinks, and local products. Moreover, with organic culinary tourism being a niche market, especially among European culinary tourists, several culinary tour operators are enjoying a competitive advantage by offering organic food options to these tourists. Thus, with the growth in organic culinary tourism market in regions such as Europe and North America, sustainable and organic culinary tourism is expected to gain popularity during the forecast period.
“Countries such as the US, the UK, Germany, France, China, Australia, and Spain are witnessing an increasing number of travelers, both domestic and international. This is contributing immensely to the growth of the global culinary tourism market. Developing countries, such as Sri Lanka, India, and Mexico, are also upgrading their tourism infrastructure, which is expected to augment the market growth during the forecast period,” says a senior analyst at Technavio.
Segmentation analysis
This market research report segments the global culinary tourism market by type (domestic and international) and geographical regions (Europe, North America, APAC, South America, MEA).
The European region led the market in 2018, followed by North America, APAC, South America, and MEA respectively. However, during the forecast period, the APAC region is expected to register the highest incremental growth due to the growing economies of APAC countries. The increase in the number of travel operators, luxury service providers, and a rising number of exotic spots and destinations will also fuel market growth.
Evolving Snack Food
Once seen as guilty pleasures, snack foods have and will continue to evolve to be eating occasion solutions for a nation of consumers constantly on-the-go, reports The NPD Group in its recently published Future of Snacking report. Americans consumed nearly 386 billion of ready-to-eat snack foods last year, with the vast majority of those eaten between main meals; and snack food growth is happening at most dayparts with more use at meals and as meal replacements.
“Snack foods continue to evolve both as between-meal snacks and as part of main meals,” says David Portalatin, NPD food industry advisor. “Each of these snack food roles is changing in different ways in reaction to Americans’ desire for balance, portable snack foods, and holistic wellness.”
Snack food needs forecast to grow in the near term embody wellness benefits, like snacks with more protein, portability, like single-serve snack foods that fit into busy lives, unique and enjoyment, like unique flavor mash-ups, according to NPD’s Future of Snacking report, which shows what snack food consumption will look like in the future and the opportunities for growth over the next five years. Even indulgent snack foods are staging a comeback by walking a line between health and enjoyment. Low calorie, high protein ice cream is an example of a beneficial snack food. Brands that support moderation as a rationale to indulge are also benefiting, like thinner versions of cookies.
The report also found that consumers snack food choices aren’t limited strictly to flavor. Emerging attributes for snack food consumers are snacks that encompass uniqueness, and sensory elements such as texture, heat, and aromatics.
“Snacking is no longer just about eating when you’re bored or eating for additional sustenance,” says Portalatin. “Today and in the future, snacking is about solving small problems for consumers, and those problems present opportunities for food marketers across a variety of dayparts and needs.”
It seems the traditional three meals a day are facing an evolution in Canada, as new research from Mintel reveals that nearly half (46 percent) of better-for-you (BFY) snackers* feel that it is healthier to snack throughout the day than to eat three large meals. In need of constant fuel, many Canadians have snacks at the ready with two-thirds (65 percent) of BFY snackers believing it’s important to always keep healthy snacks on hand.
Keeping up with their interest in snacking throughout the day, more than half (51 percent) of Canadians agree that they’d like to see more healthy snacks packaged for eating on the go. What’s more, it seems there’s potential for anything to be considered a snack among younger consumers, as 45 percent of Canadians aged 18-24 are interested in snack-sized portions of regular foods as compared to 31 percent overall.
“Snackers today are looking for ways to satisfy cravings that fit in easily with an increasingly on-the-go lifestyle. The good news is food manufacturers and foodservice providers need not start from scratch. As many consumers have adopted the notion that anything can be a snack, companies can appeal to those looking for better-for-you snacks by rethinking packaging to make items more portable rather than reinventing the wheel. This is especially crucial for foodservice vendors in particular as consumers aged 18-24 are the most likely to dine out, yet also feel the financial impact of it. This highlights an opportunity to offer smaller serving sizes of their dishes at lower price points to appeal to this group,” said Carol Wong-Li, Associate Director, Lifestyles and Leisure Reports, at Mintel.
Younger consumers prioritize protein
As consumers look to make better choices for themselves, it seems fresh and less processed snacks are coming out on top as fresh fruit and vegetables (84 percent) are the nation’s top better-for-you snack of choice, followed by cheese (79 percent), nuts (69 percent) and popcorn (60 percent). In fact, Mintel research shows the snack innovation that consumers are most likely to say they would like to see more of is products made from fresh ingredients (55 percent).
While fresh snacks are winning out, younger consumers are placing power in protein to keep them full. Three in 10 (30 percent) consumers say they eat meat snacks, with younger snackers aged 18-34 the most likely age group to agree (41 percent). Although just 16 percent of consumers say they are interested in snack bars made with meat, one third (32 percent) of men aged 18-34 are keen to see more of this type of offering.
Following the growing flexitarian movement, it seems that plant-based has potential when it comes to better-for-you snacking as three in 10 (29 percent) consumers say they are interested in snacks made with plant-based protein, rising to four in 10 (39 percent) among women aged 18-34.
“Protein is a key area of interest for younger Canadians when it comes to innovations in healthy snacks, but men and women differ when it comes to the actual source of protein they prefer. While young women show interest in plant-based proteins, men are more likely to turn to meat. This may stem, in part, to the different approaches taken to snacking. Younger women tend to snack because they are too busy to eat meals, whereas young men usually do so as a way to refuel after exercise. Marketers looking to promote plant-based proteins will see success by focusing on how these ingredients work to keep consumers fuller longer, while brands promoting meat can focus on how the quality of the meat protein contributes to muscle building, recovery and/or development,” said Wong-Li.
Healthfulness of BFY snacks comes into question
While Canadians are keen to enjoy healthy snacks, there are significant concerns. Nearly three-quarters (73 percent) of BFY snackers believe that many snacks marketed as healthy are not actually healthy, with just 41 percent saying they trust the health claims on food and beverage packaging. And for many, there’s confusion when it comes to making a healthy snack choice, as half (49 percent) say it is hard to tell if a snack is healthy.
“Many consumers today have difficulty determining the healthfulness of snacks and hold a general distrust of claims on food and beverage packaging. This may be drawing them toward choosing fresh and less processed snacks, rather than processed and/or packaged ones. Marketers can boost perceptions of healthfulness of their products by highlighting whole and/or fresh ingredients the products include and featuring clear packaging to both showcase the ingredients and offer transparency,” concluded Wong-Li.
Allergan Confusion
Allergen food labels are a source of confusion for today’s Brits according to latest research from Mintel, as only 37 percent of consumers agree that it is easy to identify which allergens a product is free from by its label.
While pre-packaged goods are legally required to highlight on-pack the presence of any allergens, almost half (48 percent) of Brits are unsure whether or not allergen labels are clear, and a further 15 percent actively disagree that this is the case.
Meanwhile, a UK-wide allergen labelling system on free-from product packaging appeals to 29 percent of those who have bought/used free-from products, a figure which rises to 39 percent of those users who avoid foods/ingredients because of an allergy or intolerance.
Estimated to be worth £837 million in 2018, the UK free-from market has seen stellar growth over 2013-18 with sales growing by 133 percent over this time period.
Emma Clifford, Associate Director of Food and Drink at Mintel, said, “Potential changes to allergen labelling has received a lot of high profile media coverage recently, with speculation that the Government is planning to introduce new changes following the death of Natasha Ednan-Laperouse, who died after suffering an allergic reaction to a Pret baguette. Given the perceived lack of clarity and the dangerous health implications that ambiguous allergen labelling can have on consumers, there is a real need for companies to make the presence of allergens very obvious on labelling.
“While current regulations require allergens to be listed in bold on the ingredients list, many companies choose to highlight certain free-from credentials on the front of packaging as well. At the moment this is not regulated and as such, there is no uniformity between the labelling used, which can fuel confusion among consumers, particularly given the huge amount of other product information on packaging. There is strong demand for a UK-wide labelling system for allergens which would unify the way in which companies communicate this information on packaging.”
According to Mintel, just under half (48 percent) of consumers say that they, or someone in their household, avoid at least one food/ingredient, with 16-24-year-olds (61 percent) the most likely age group to report household avoidance of foods/ingredients. Overall, there has been no significant change in the share of UK consumers that avoid certain foods or ingredients over the past year.
Perhaps surprisingly, only 20 percent of consumers (or other members of their household) avoid certain ingredients due to an allergy or intolerance, which is on a par with those who do so as part of a healthy lifestyle (22 percent). Of those who have eaten/drunk free-from foods, 28 percent do not avoid any foods/ingredients.
Meanwhile, three in ten (30 percent) Brits avoid certain foods/ingredients for other reasons (eg ethical, vegetarian) rising to 38 percent of under-25s and 41 percent of females in this age group.
While dairy is the most commonly avoided food/ingredient (17 percent), avoidance of dairy has remained unchanged over the last three years. Soya (16 percent), fish or shellfish (16 percent), red meat (15 percent) and lactose (15 percent) make up the top five foods/ingredients which Brits avoid.
“Allergies or intolerances aren’t the main reason that consumers are avoiding certain foods or ingredients. Healthy lifestyles and ethical and environmental concerns are also boosting the appeal of these products, with young consumers in particular most likely to be driven by these factors.
“The fact that as many as a quarter of free-from purchasers do not avoid any foods/ingredients reflects that the pool of free-from users is far wider than just those who fully avoid certain ingredients, either due to allergies/intolerances or for other reasons.”
Gluten-free is most commonly bought free-from food
Gluten-free products remain the nation’s most popular type of free-from food with 27 percent of consumers having purchased or eaten these over six months, despite only 12 percent of consumers reporting that they or somebody else in their household avoid gluten.
Meanwhile, a quarter (23 percent) of consumers have purchased dairy substitutes, while 19 percent have bought dairy-free foods.
A quarter (26 percent) of consumers say free-from diets are good for digestive health, but 44 percent say that it is hard to know whether they have health benefits for those without an allergy or intolerance. A further 40 percent worry that following a free-from diet puts you at risk of missing out on certain nutrients.
“The idea that following a free-from diet could potentially put people at risk of missing out on certain nutrients is a concern for a significant number of consumers. Gluten-free products carrying nutrient fortification claims are not widespread in the UK market, suggesting a missed opportunity. While highlighting the absence of allergens is vital, spotlighting nutritional credentials is also important for free-from products, particularly to appeal to those opting for these products as part of a healthy lifestyle.
Evolving Artisan and Specialty Cheese
The artisan and specialty cheese industry is evolving, according to the American Cheese Society’s (ACS) newly released reports from its State of the U.S. Artisan/Specialty Cheese Industry Survey. There are nearly 1,000 artisan and specialty cheesemakers in the U.S., researchers found, a number which has increased significantly over past decades. Seventy-six percent of cheesemakers reported annual cheese production of 50,000 pounds or less, indicating that this growing industry largely consists of smaller businesses.
Cheese continues to top U.S. specialty food sales at more than 4 billion dollars in 2017, according to the Specialty Food Association. Yet the artisan and specialty cheese industry is not without challenges – despite overall growth, just 80 percent of cheesemakers operated profitably in 2017, and average profit margins were slim. Ninety-two percent of cheesemakers reported that maintaining profitability is an area of concern. Unsurprisingly, cheesemakers that reported a higher production volume averaged higher gross revenue. However, strong revenue doesn’t necessarily translate to profit. The higher the cheesemaker’s gross revenue, the lower the profit margin on average – evidence that bigger isn’t necessarily better in the artisan and specialty cheese industry.
“Cheesemakers put an incredible amount of passion into creating their products, and these in-depth surveys show just how challenging that work can be,” says ACS Executive Director Nora Weiser.
Oyster Sauce Market Forecast
The global oyster sauces market is expected to post a CAGR of over four percent during the period 2019-2023, according to the latest market research report by Technavio.
The penetration of pre-made meals and online grocery home delivery services have reduced restaurant visits and expenditure at food-service outlets among cost-conscious consumers. Furthermore, with ready-made recipes available, oyster sauce is a critical ingredient in many fast food dishes. Cooking shows are also encouraging people to experiment and cook at home. Moreover, increasing awareness of healthy eating habits, is leading to the growing preference and propensity for home cooking, which will increase the demand for oyster sauce during the forecast period.
As per Technavio, the increasing innovations in packaging will have a positive impact on the market and contribute to its growth significantly over the forecast period. This global oyster sauces market 2019-2023 research report also analyzes other important trends and market drivers that will affect market growth over 2019-2023.
Innovations in packaging
Packaging plays a crucial role in the sale of oyster sauce as it helps retain the flavor, taste, quality, and texture. Packaging is a brand extension of the product and is a crucial factor that influences the purchase decision of consumers. Therefore, several major companies are collaborating with packaging manufacturers to develop advanced packaging technologies and attract consumers. The shelf life of oyster sauce shelf life depends on the ingredients, production methods, and packaging method. Manufacturers are also offering oyster sauce in small, convenient packets.
“Apart from the innovations in packaging, the increasing number of product launches, growth in the retail landscape, and increasing oyster production are some major factors that are expected to boost the market during the forecast period,” says a senior analyst at Technavio.
Segmentation analysis
This market research report segments the global oyster sauces market by end-user segment (retail and foodservice) and geographical regions (APAC, North America, Europe, South America, and MEA).
The APAC region led the market in 2018, followed by North America, Europe, South America, and MEA respectively. However, during the forecast period, the North American region is expected to register the highest incremental growth due to the growing popularity of the Asian cuisine and many Asian vendors expanding their businesses to increase their market share in the region.
MRM Research Roundup: End-of-January 2019/Super Bowl Edition posted first on
happyhourspecialsyum.blogspot.com